Teleconnection skills v/s Mean state skills
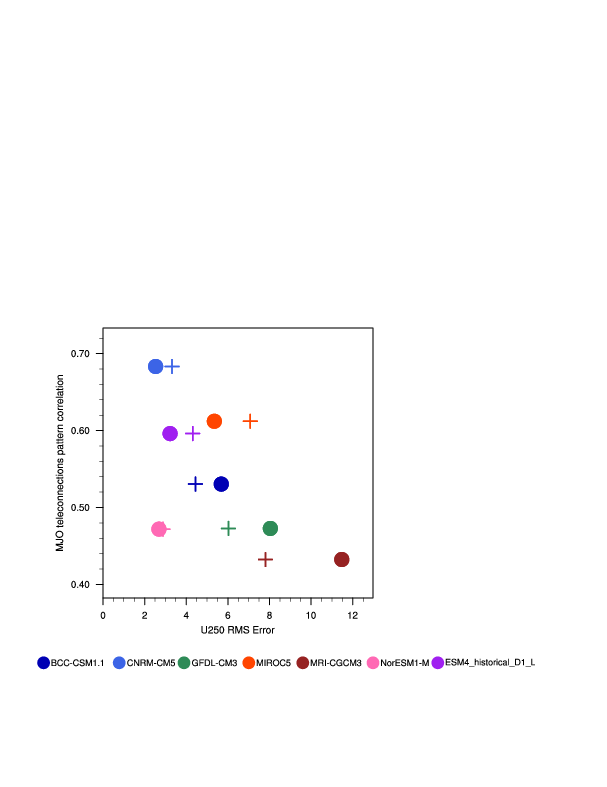
Teleconnection pattern correlation averaged for all MJO phases (y axes) relative to the 250-hPa mean zonal wind RMS error, the plus signs show the model zonal wind RMS error over the full Pacific basin, while the filled circles indicate the longitudinal RMS error in the region of the sub- tropical jet. See text (Henderson et al. 2017 J Climate) for more detailed explanations.